Validation — EyanaSSDSim vs FEMU (WAF)
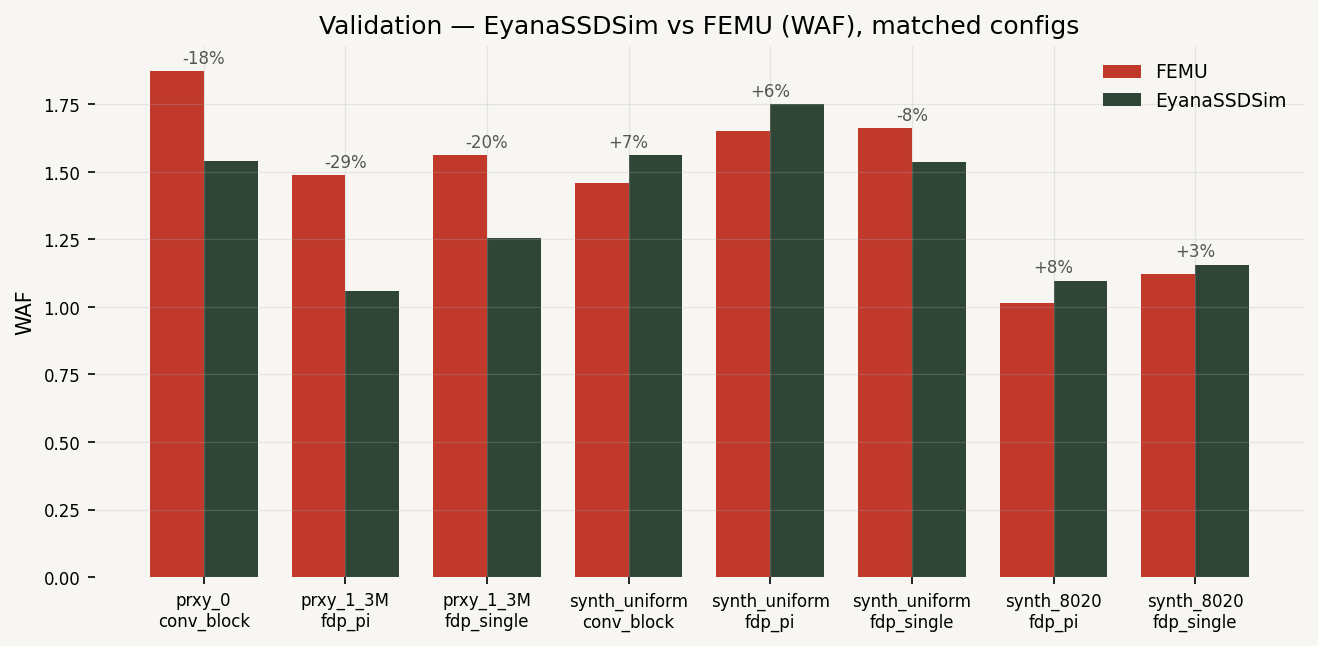
Our finding. EyanaSSDSim reproduces FEMU's write amplification closely and predictably. On synthetic workloads the two agree to within ±3–8% with mixed signs (no systematic bias); on real traces the simulator sits a consistent 18–29% below FEMU — a single-cause, one-directional gap we trace entirely to garbage-collection erase granularity (block- vs superblock-level reclaim).
How this helps our work. Agreement with a hardware-accurate emulator is what lets us trust every result that follows. Because the one systematic difference is understood and bounded (granularity, see the Bracket graph), we can use EyanaSSDSim for the placement and distribution study with confidence that its numbers are faithful to real hardware — and match FEMU exactly by switching the GC granularity when we need to.
What it shows. WAF (physical/host writes) from EyanaSSDSim next to FEMU for eight
configurations at the same over-provisioning (OP 25%). FEMU conventional points come from
fio fill (OP set by fill size, 3× rewrite for steady state); FDP points
from a custom fdp_write tool over NVMe pass-through; WAF is read from FEMU's
instrumented FTL counters (host/gc, hbmw/mbmw).
- Synthetic, sim vs FEMU: uniform conv +7.1% (1.56 vs 1.46), uniform FDP-single −7.5% (1.54 vs 1.66), uniform FDP-PI +6.1% (1.75 vs 1.65), 80/20 FDP-single +3.2% (1.16 vs 1.12), 80/20 FDP-PI +8.0% (1.10 vs 1.02) — errors cancel, no bias.
- Real traces, sim vs FEMU: prxy_0 conv −17.8% (1.54 vs 1.87), prxy_1_3M FDP-single −19.6% (1.26 vs 1.56), FDP-PI −28.8% (1.06 vs 1.49) — systematically low, one direction.
- Trend fidelity: the ordering of configs is preserved (Spearman ρ = 1.0); the simulator is always ≤ FEMU on real traces, exactly as the granularity model predicts.