Evaluation Graphs
Every figure from the full EyanaSSDSim evaluation — validation against the hardware-accurate FEMU emulator, write-amplification and placement comparisons, and the distribution of wear and invalidity that is the heart of this work. Click Details on any graph to read exactly what it shows and why it matters.
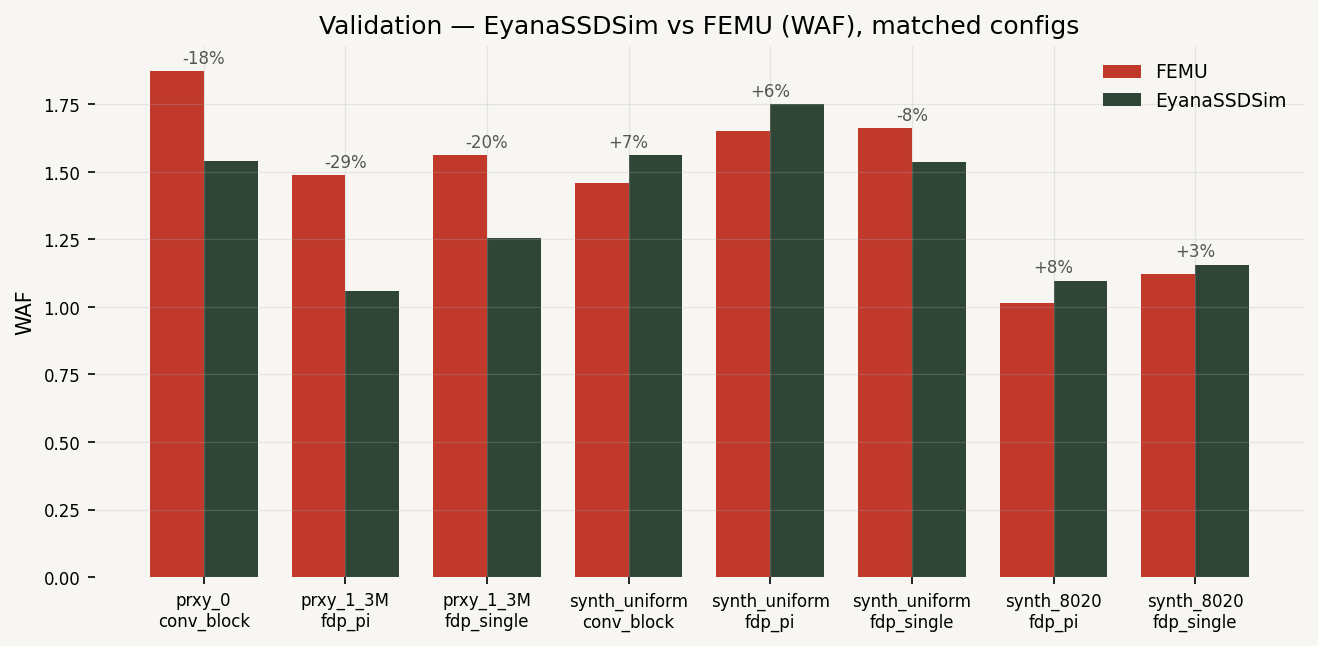
Validation — EyanaSSDSim vs FEMU (WAF)
Simulator write-amplification vs the hardware-accurate FEMU emulator, across 8 configuration-matched points.
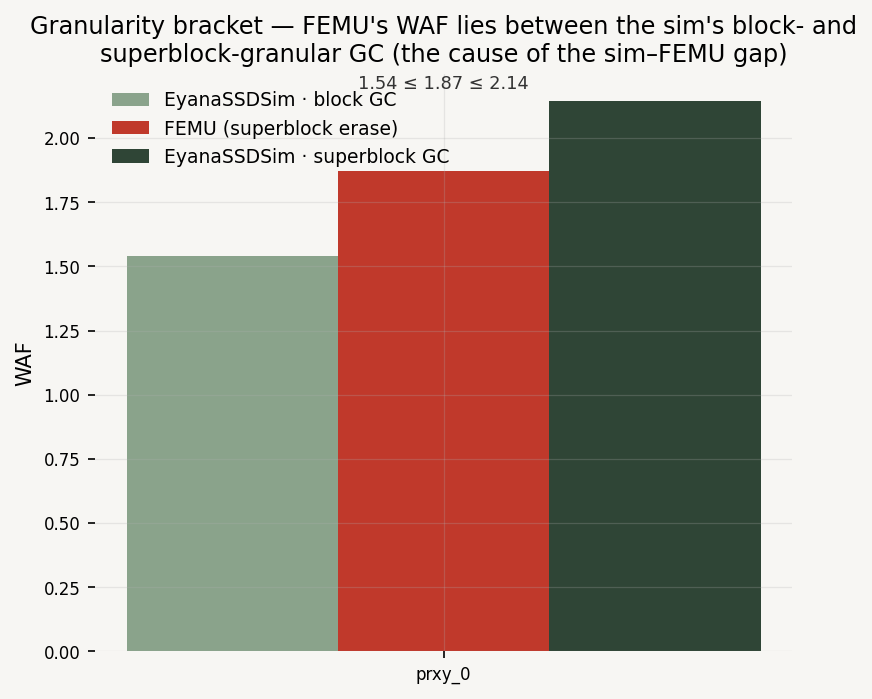
Granularity Bracket — FEMU between block & superblock GC
FEMU's WAF lies between the simulator's block- and superblock-granular GC — the mechanistic cause of the sim–FEMU gap.
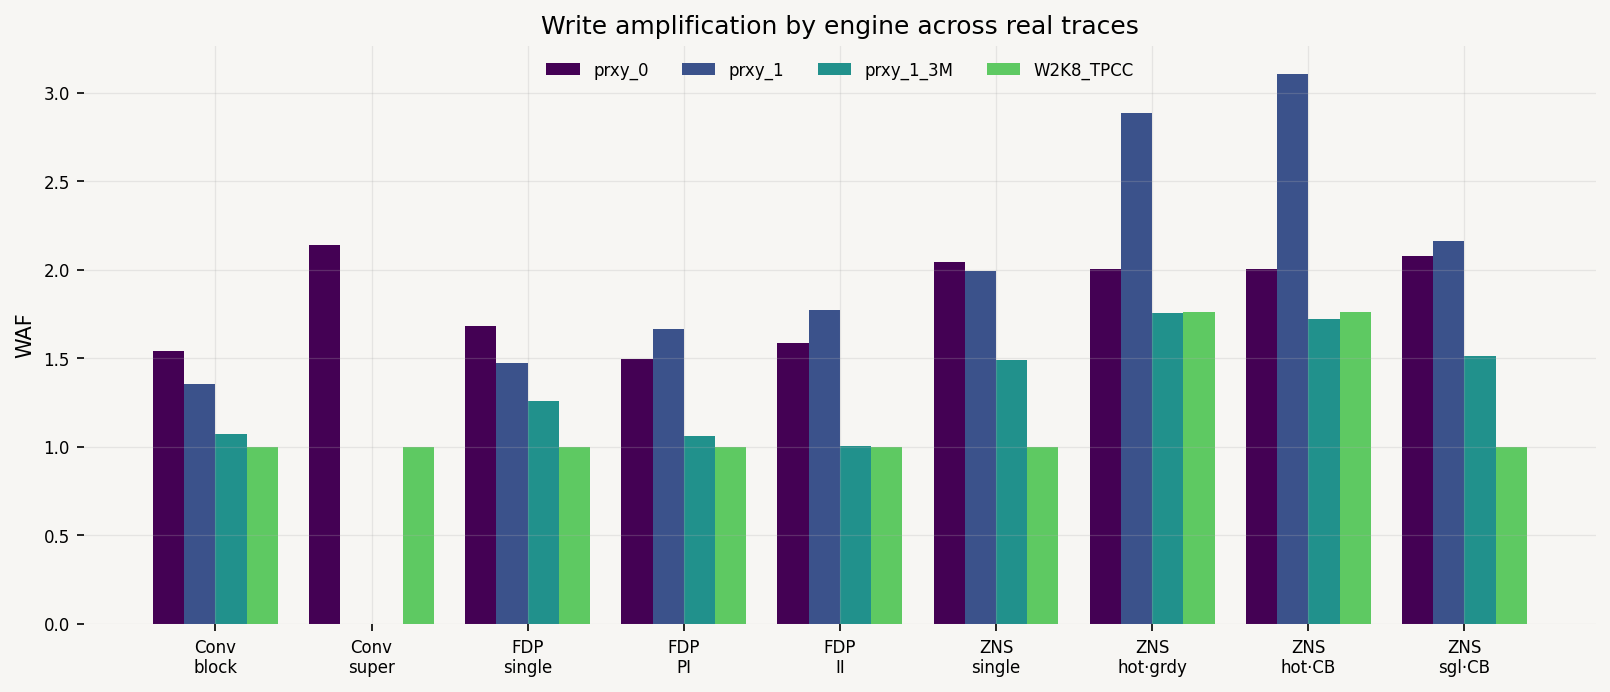
Write Amplification by Engine across Real Traces
Head-to-head WAF of all nine engines on every real trace.
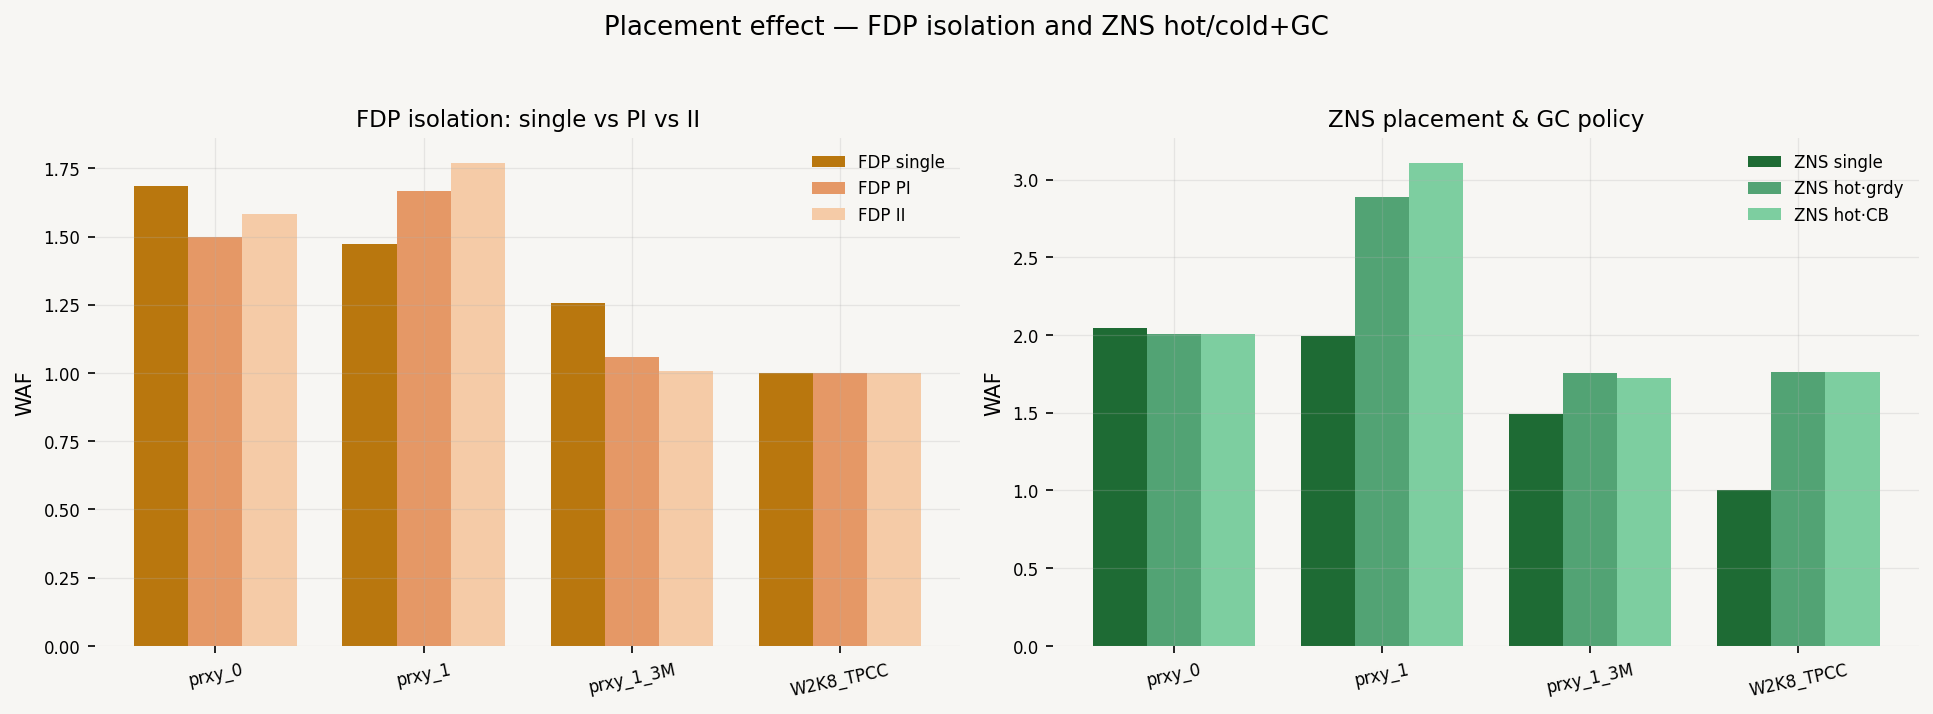
Placement Effect — FDP Isolation & ZNS GC
FDP single vs PI vs II, and ZNS hot/cold with greedy vs cost-benefit GC.
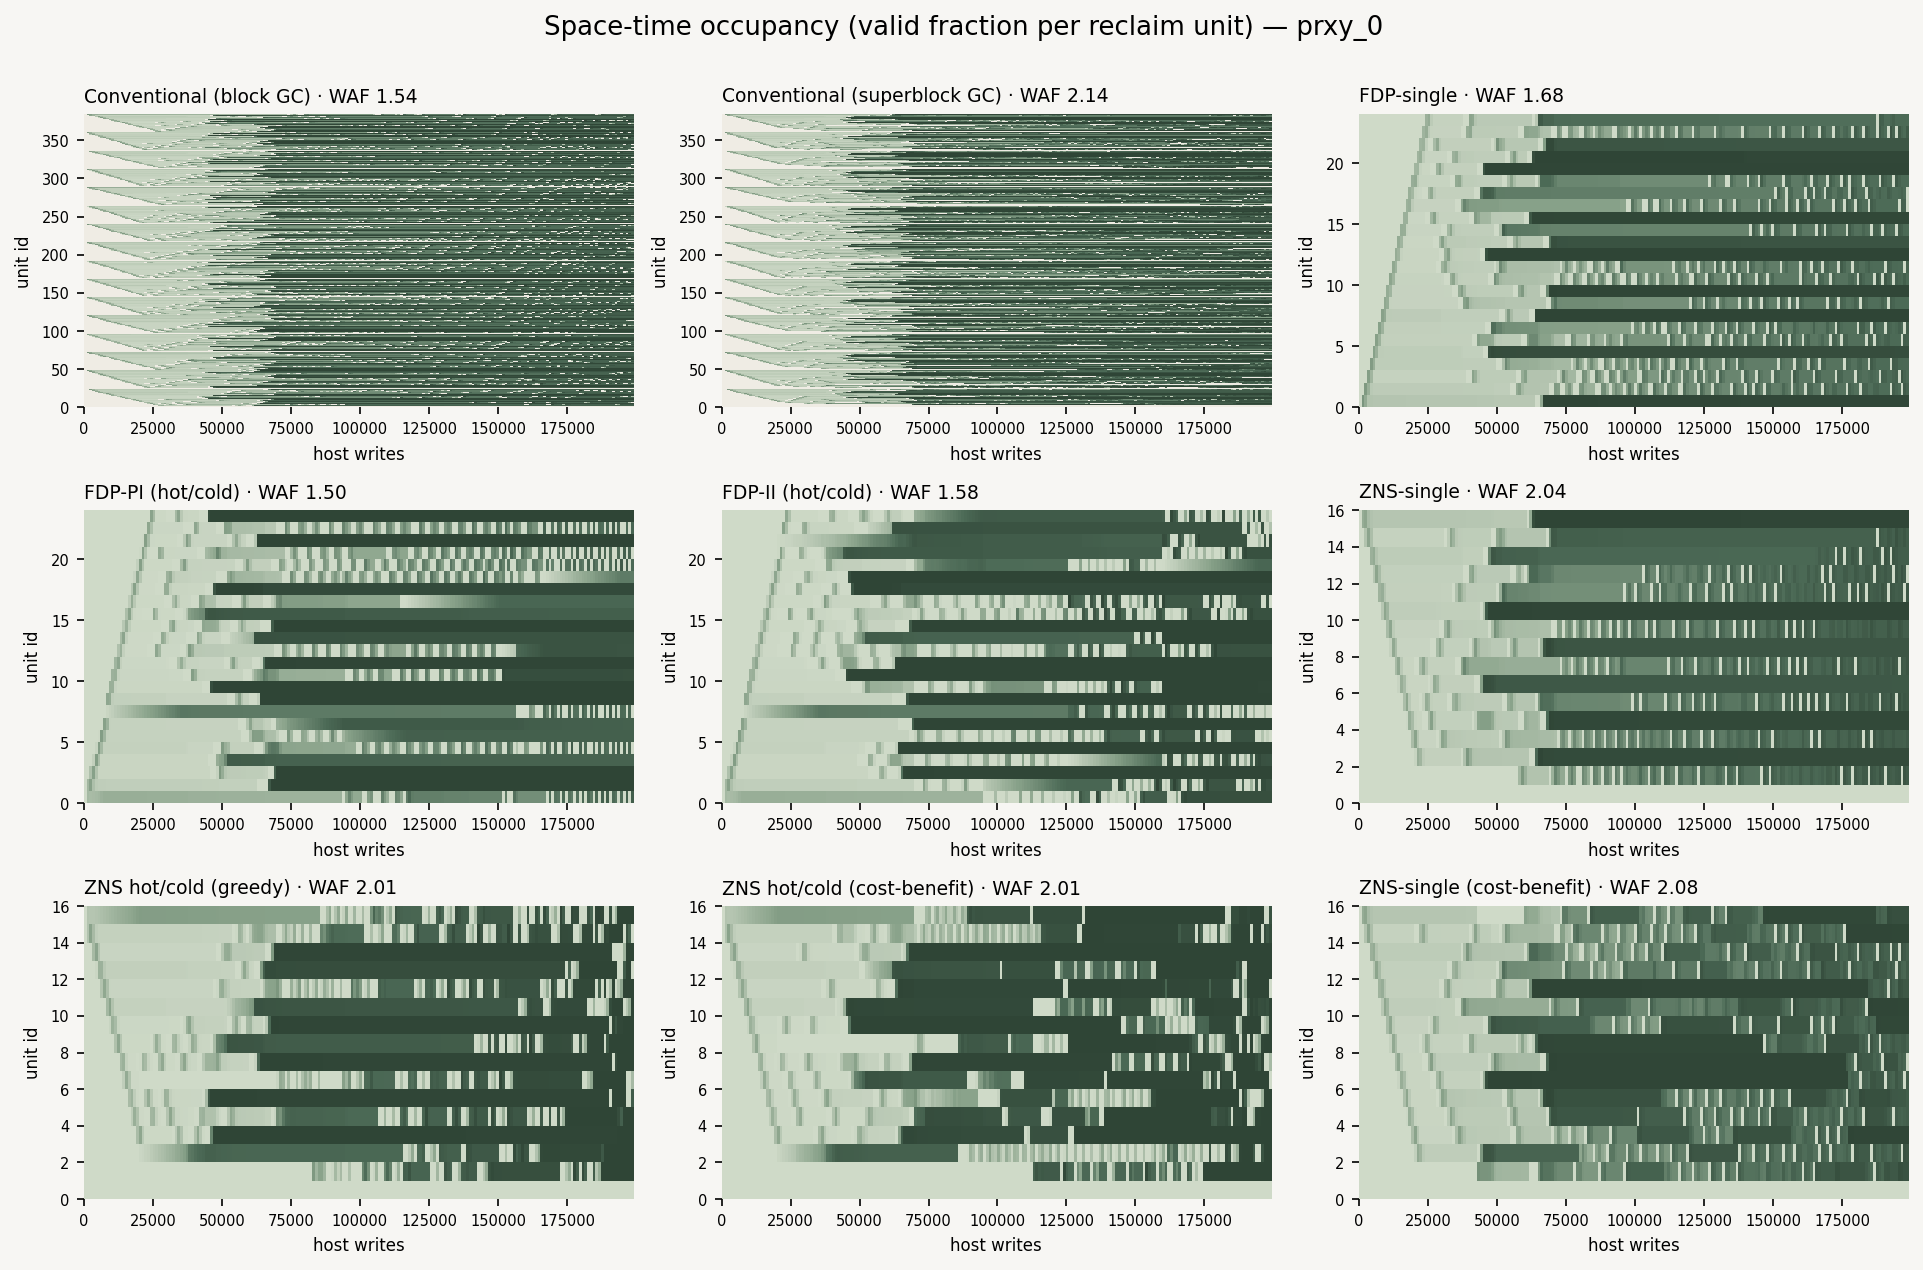
Space-Time Occupancy Heatmaps
How valid data is distributed over reclaim units and time — the flagship “how it's distributed” visualization.
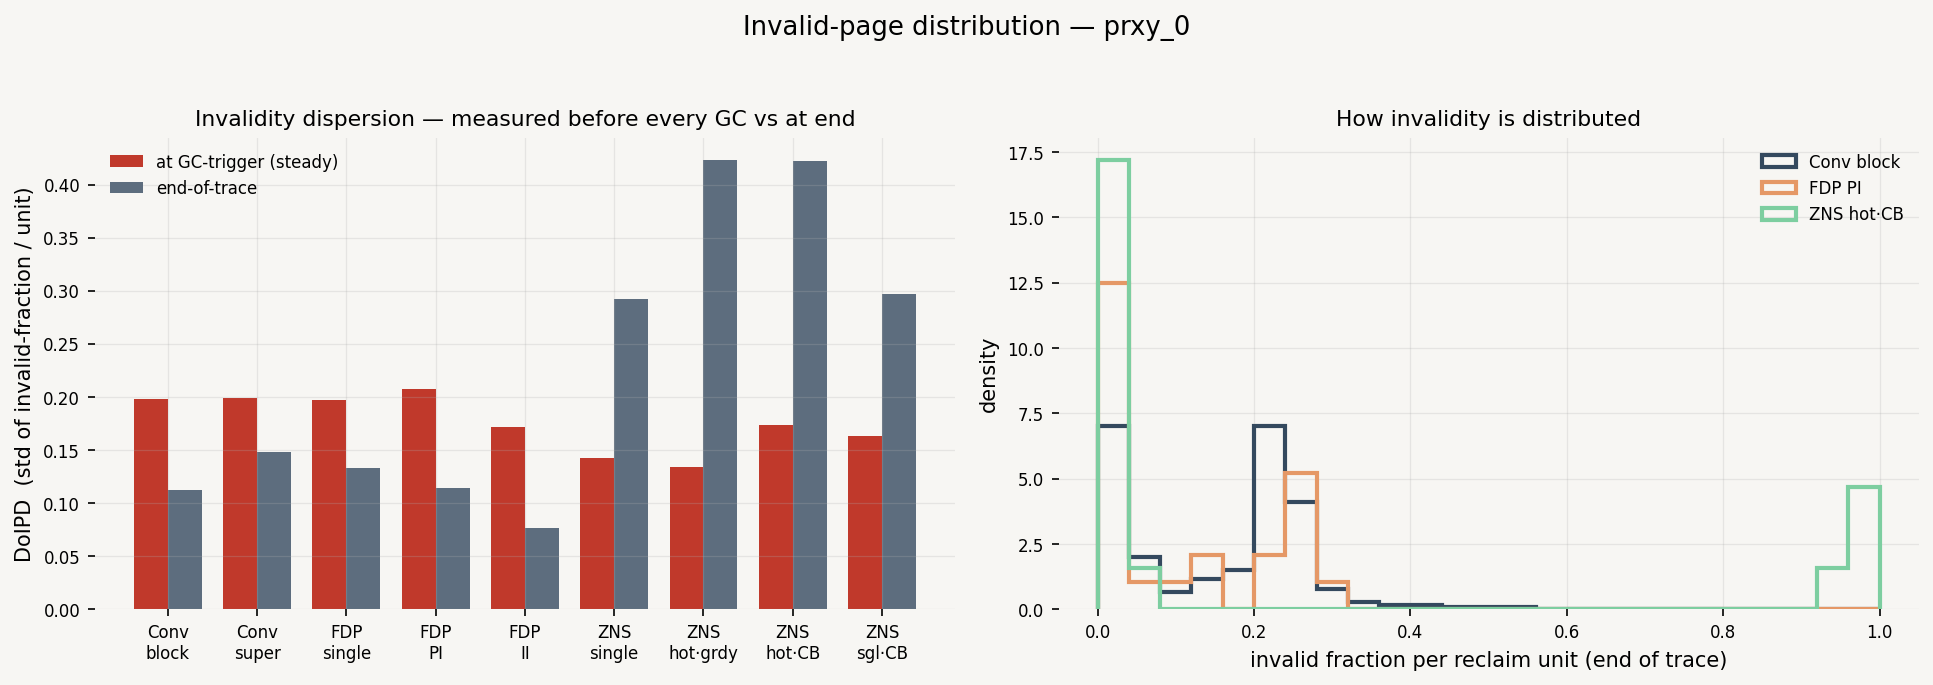
Invalidity Distribution (DoIPD)
Degree of Invalid-Page Distribution, measured correctly before every GC trigger — not at end of trace.
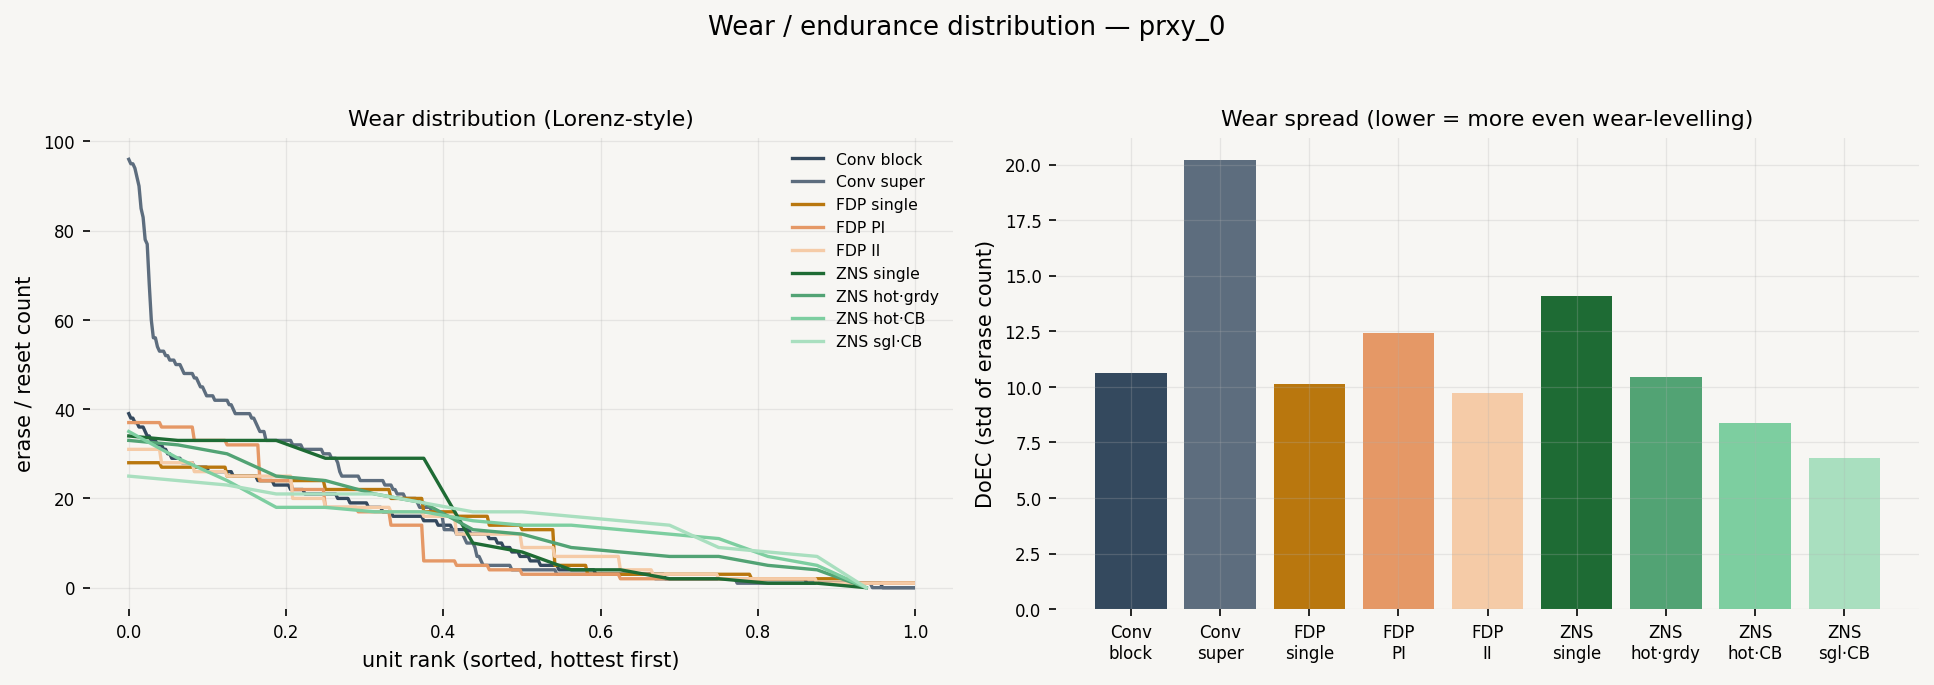
Wear / Endurance Distribution (DoEC)
How erase/reset cycles spread across the device — endurance and wear-levelling per engine.
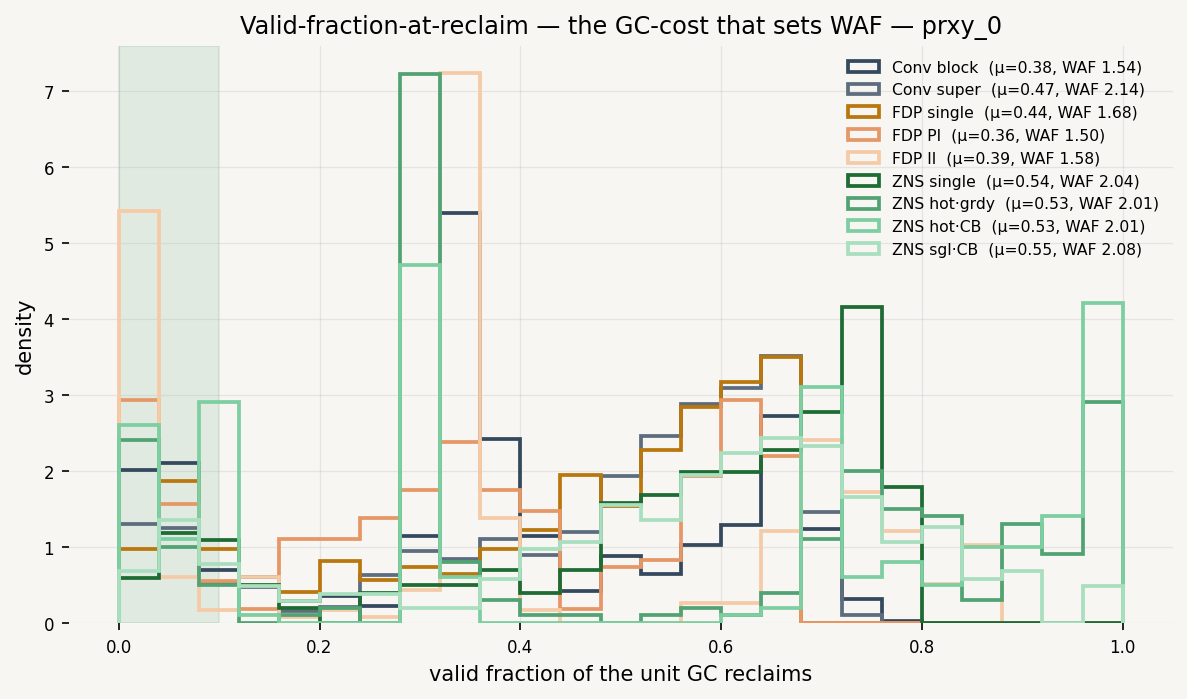
Valid-Fraction-at-Reclaim (the WAF mechanism)
The valid fraction of the unit GC reclaims — the direct cost that sets write amplification.
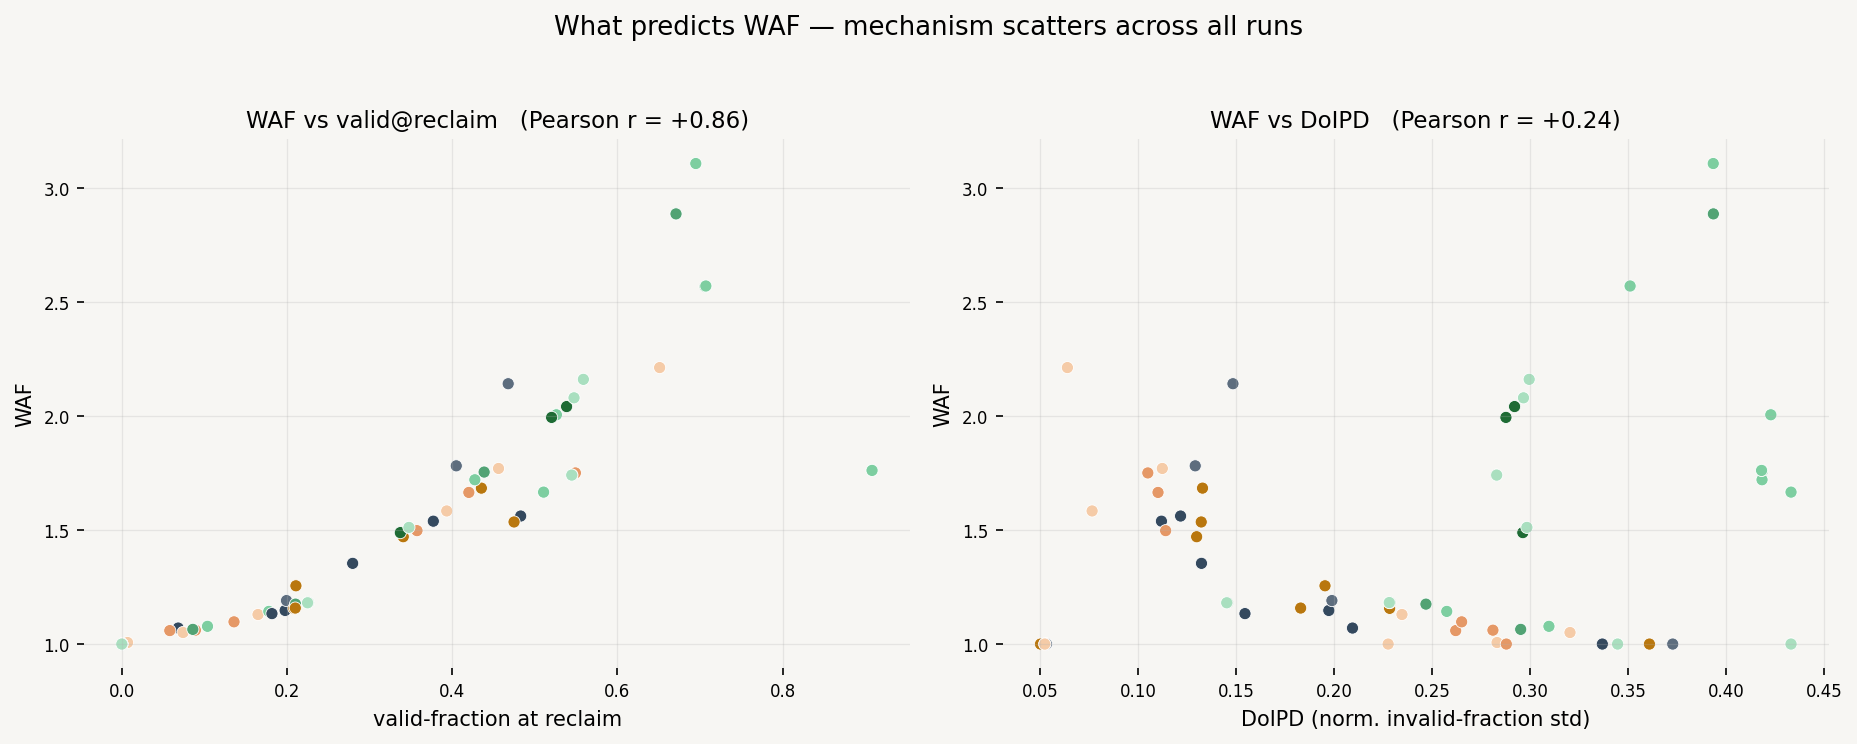
What Predicts WAF — Mechanism Scatters
WAF vs valid-at-reclaim (r=+0.92) vs WAF vs invalidity dispersion (r=+0.55) across every run.
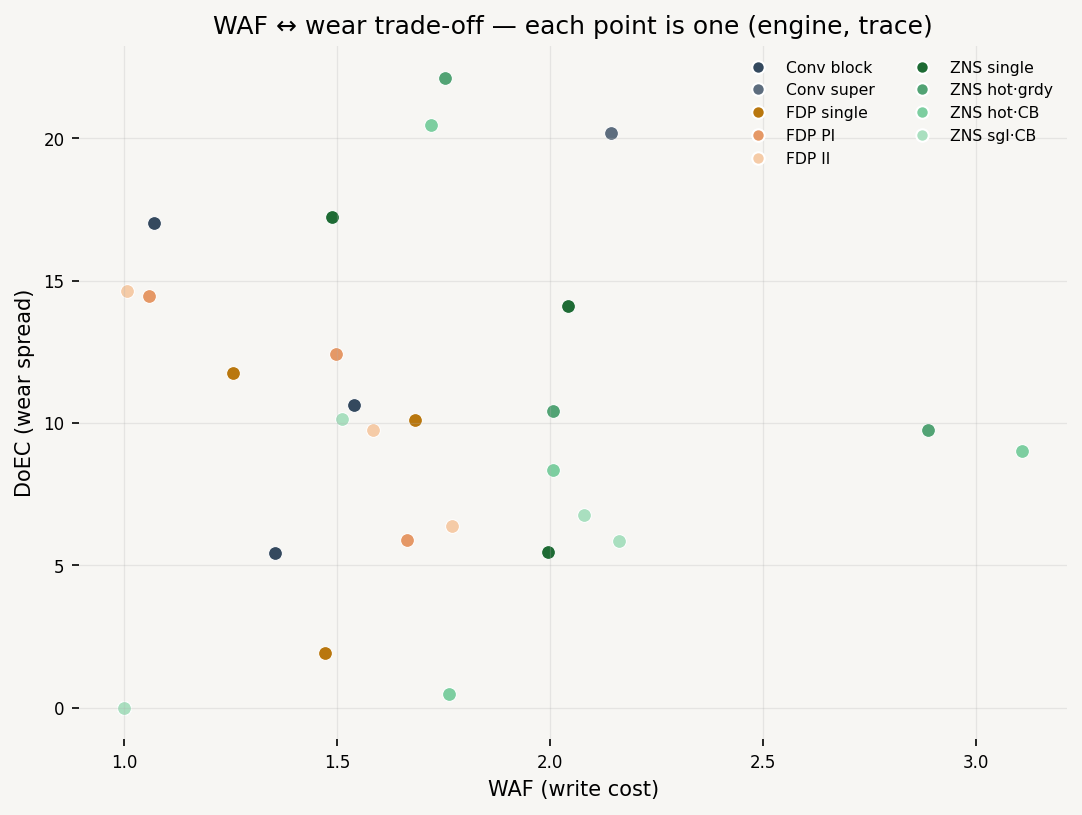
WAF ↔ Wear Trade-off
Every (engine, trace) plotted as write-cost (WAF) vs wear-spread (DoEC).