Distribution
Wear / Endurance Distribution (DoEC)
Our finding. Write amplification and wear-evenness are separate axes: a policy can look good on WAF yet concentrate erases on a few units. Coarse (superblock) GC in particular nearly doubles the wear spread on prxy_0 (DoEC 20.2 vs 10.6 for block GC).
How this helps our work. It adds the endurance dimension to the distribution study — SSD lifetime is bounded by per-block erase count, so how evenly wear is spread matters as much as WAF. This lets us judge each placement policy on durability, not just write cost.
What it shows. Left: a Lorenz-style curve of erase/reset counts (units sorted hottest-first) — flat = even wear, steep = concentrated. Right: the Degree of Erase Count (DoEC, std of erases per unit) for each engine.
What we found
- Coarse erase concentrates wear. On prxy_0, superblock GC nearly doubles the wear spread vs block GC (DoEC 20.2 vs 10.6) — the endurance price of the lower-WAF-looking coarse reclaim.
- WAF and wear can diverge. ZNS hot/cold-greedy on prxy_0 keeps DoEC low (10.4) despite a high WAF, whereas FDP-PI trades a little wear spread (12.4) for much lower WAF.
- Wear-count distributions are mostly uni-modal (Sarle < 0.55) except the pathological coarse-GC cases, i.e. wear is spread rather than split into hot/cold block populations.
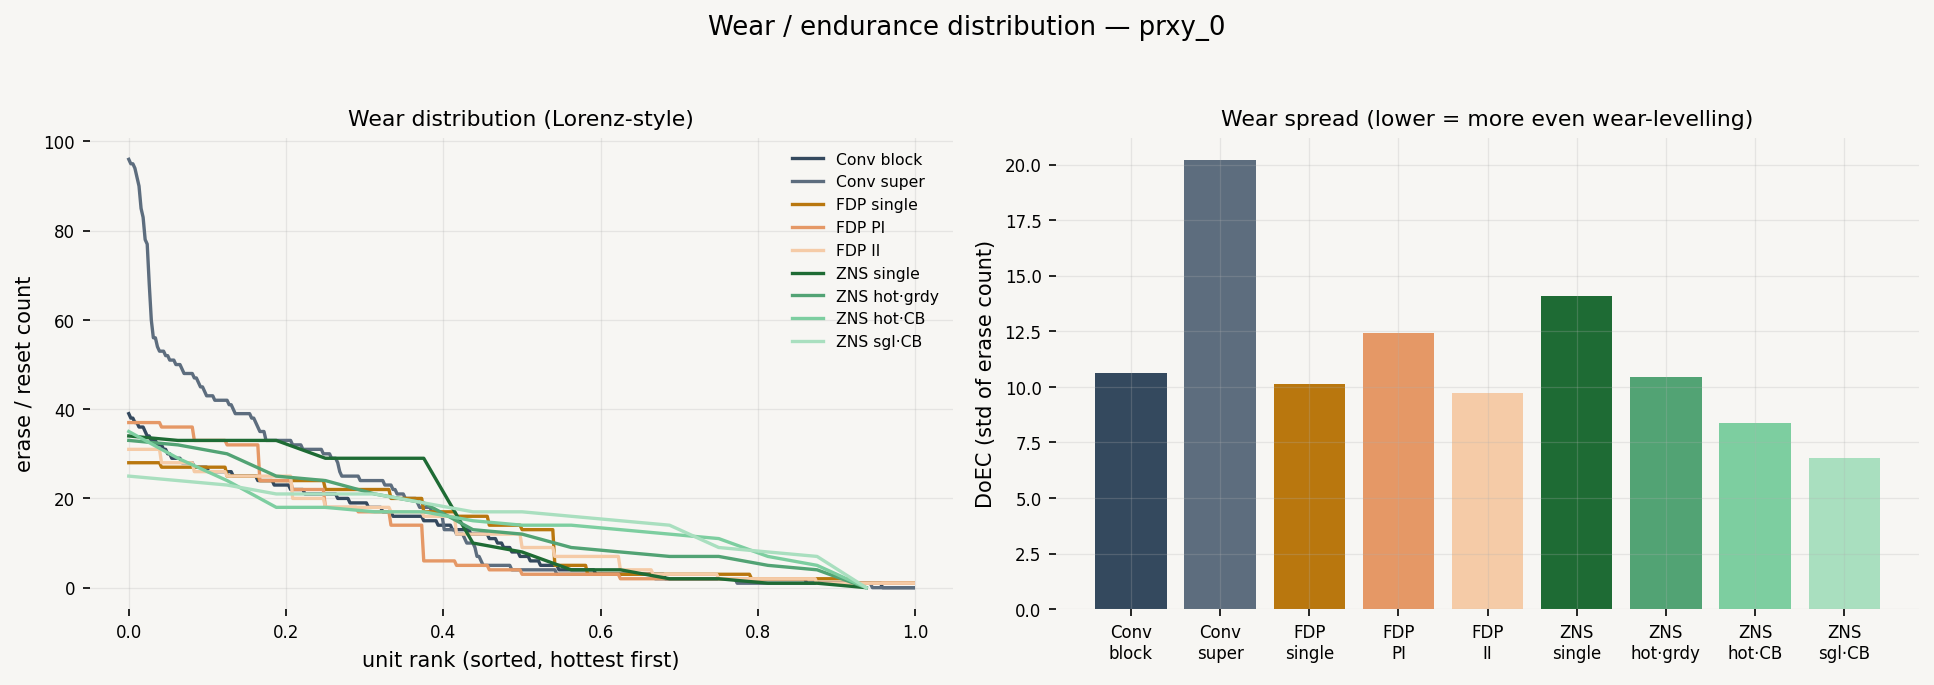
prxy_0 (MSR real)
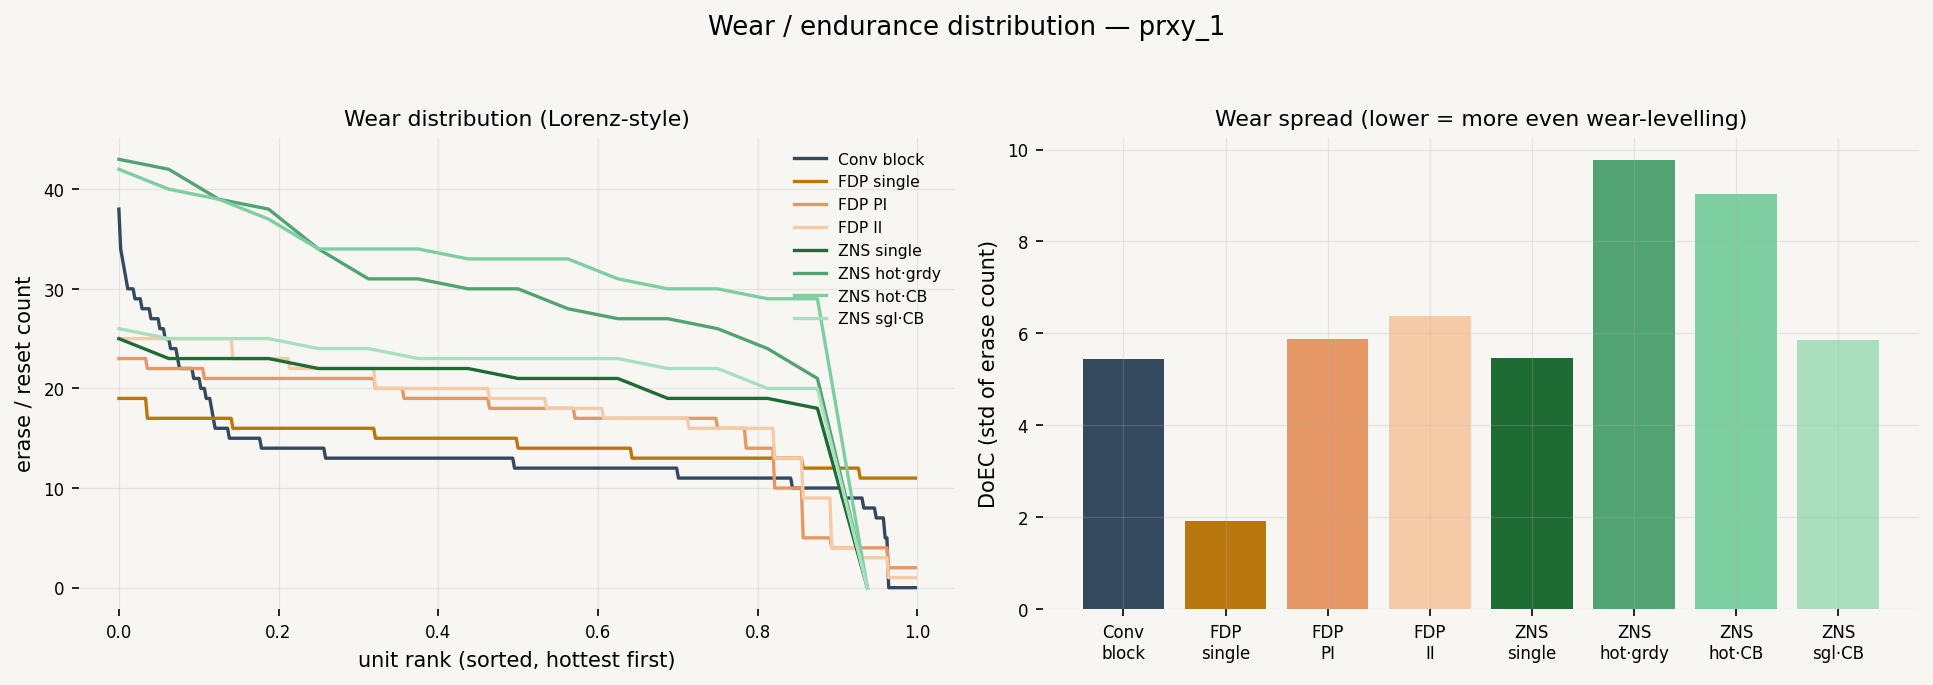
prxy_1 (MSR real)
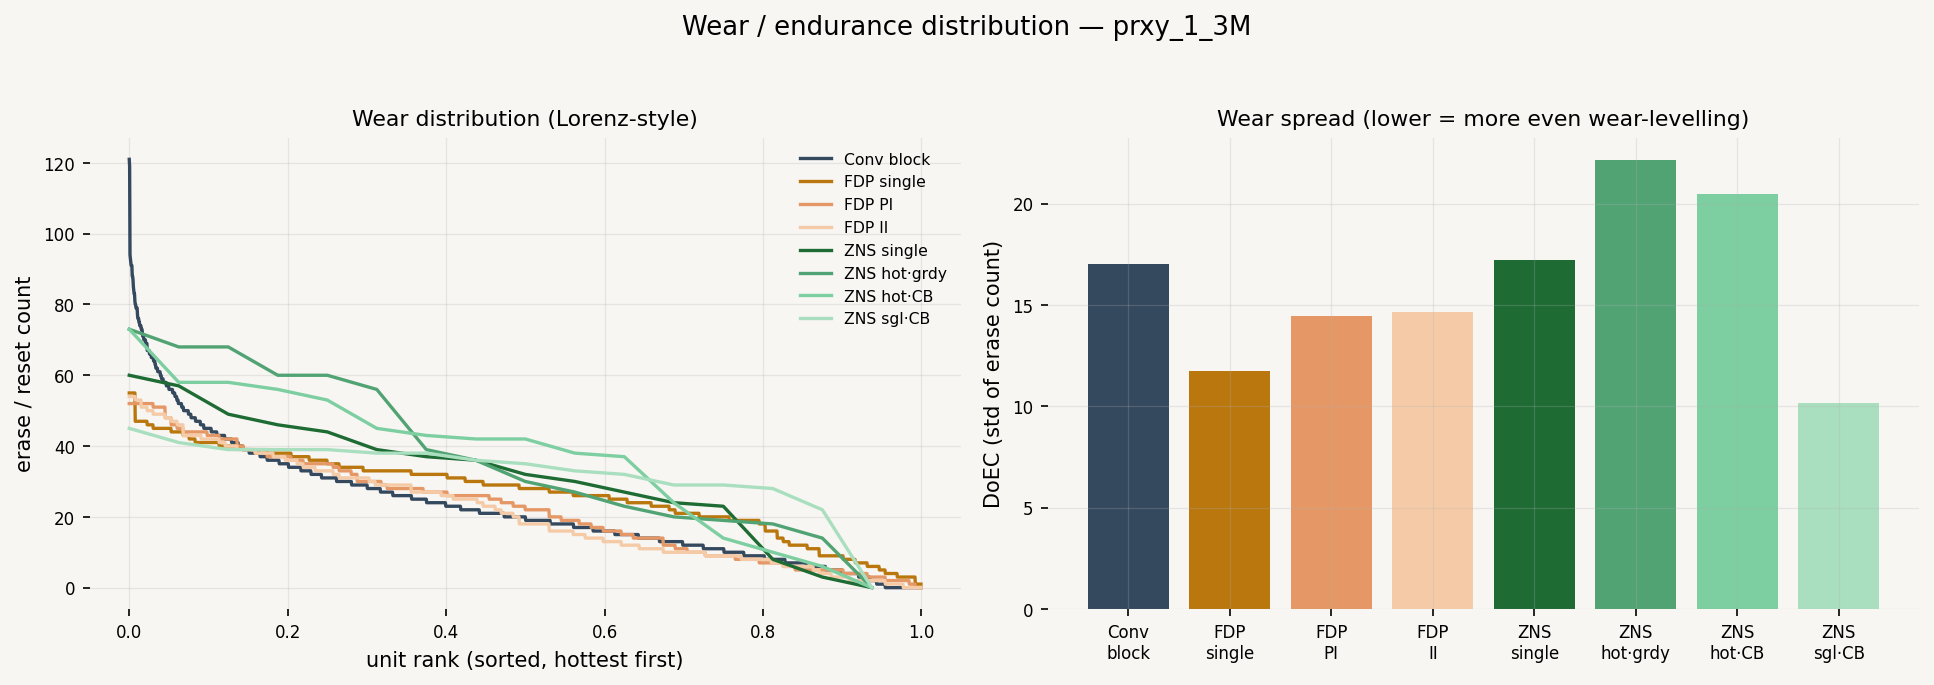
prxy_1 (3M writes, real)
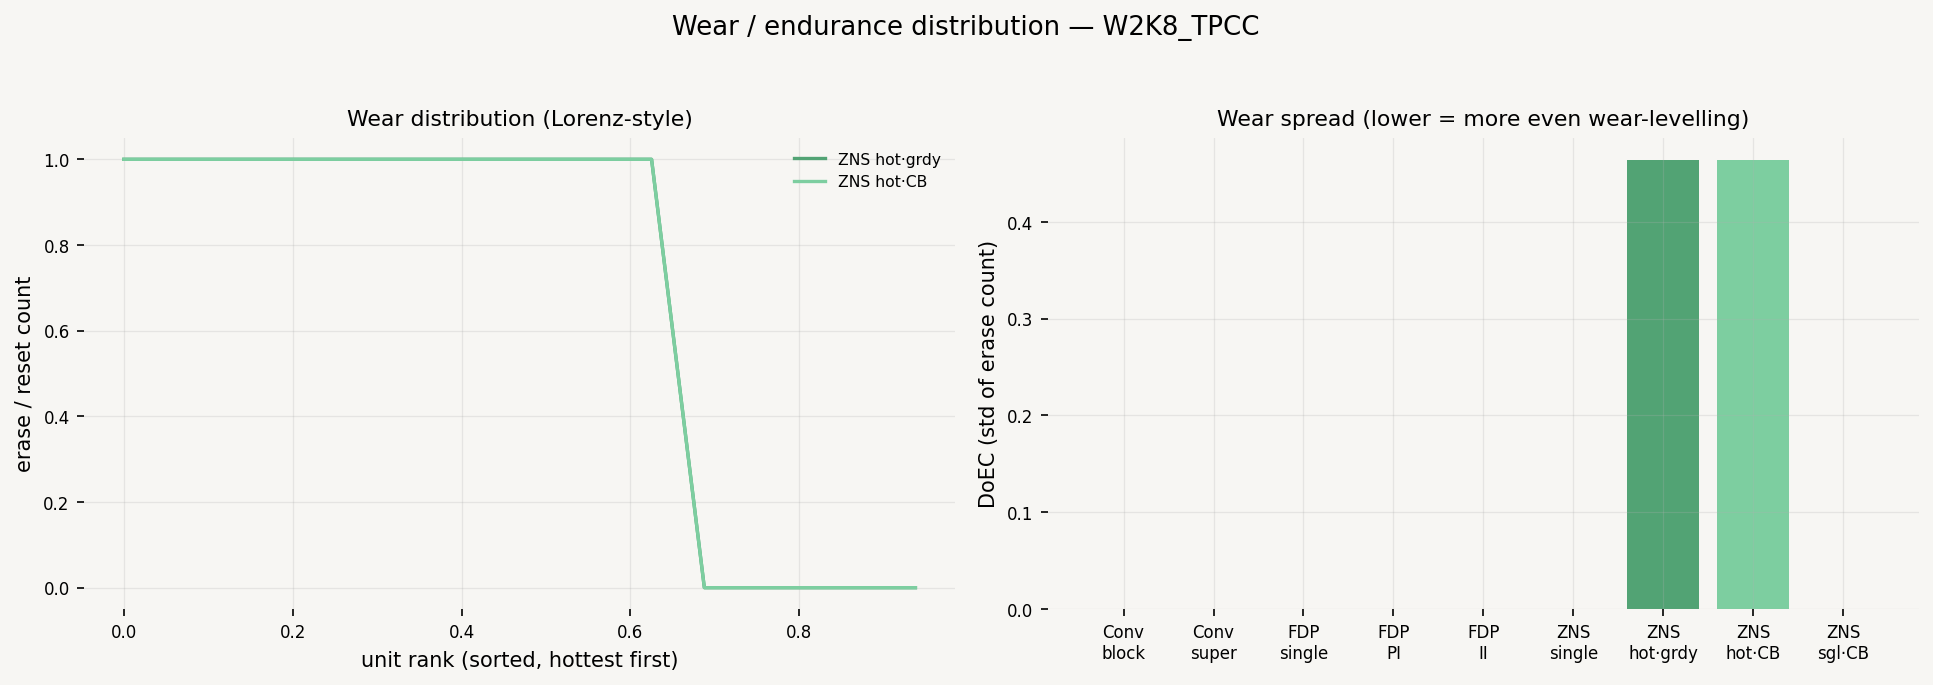
TPC-C (W2K8, real)
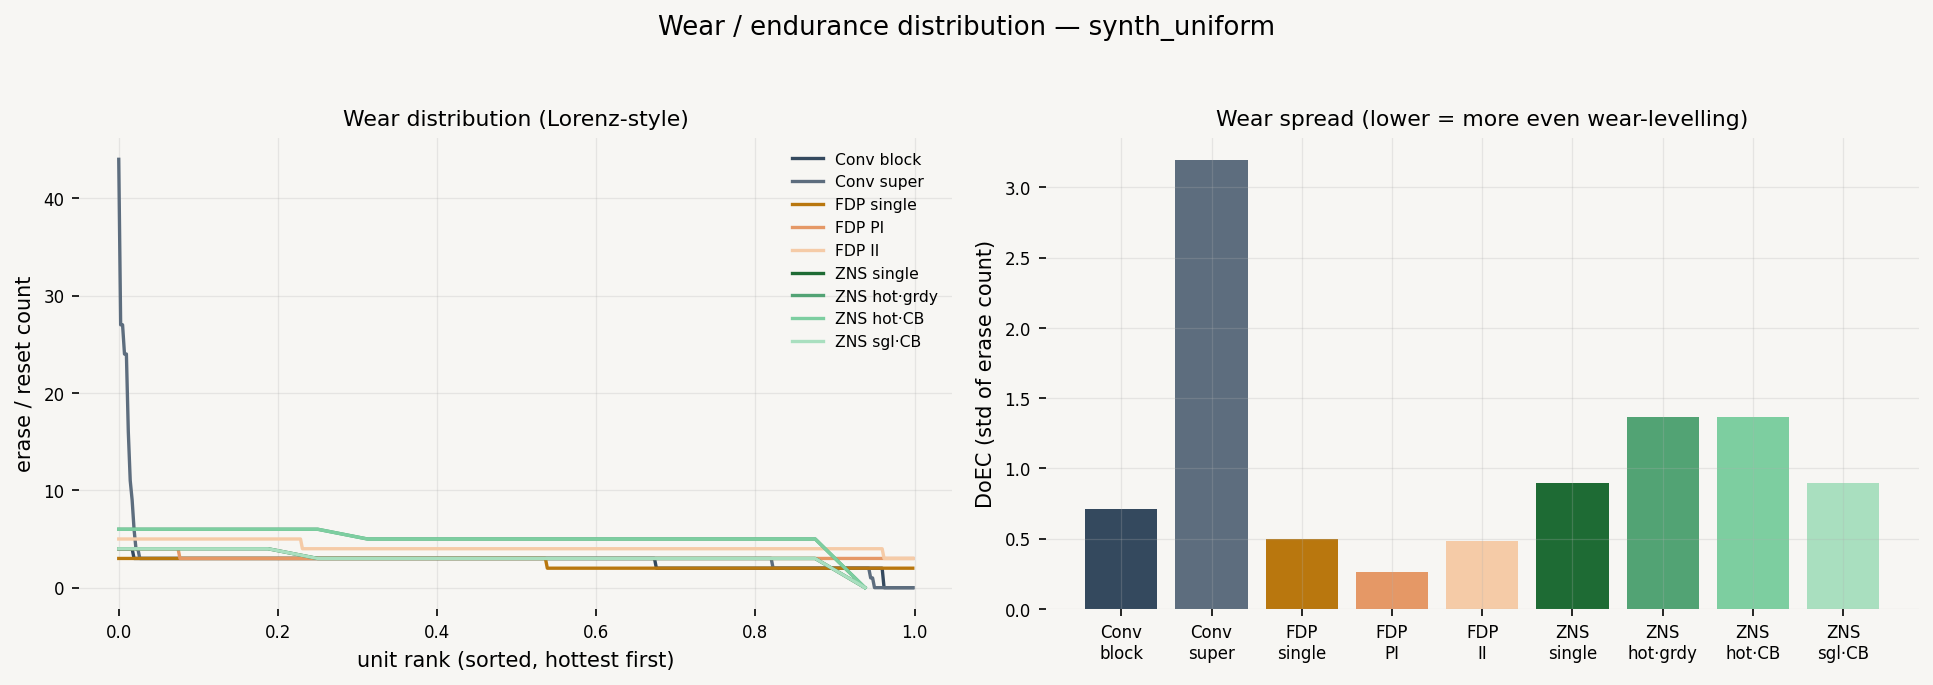
uniform (synthetic)
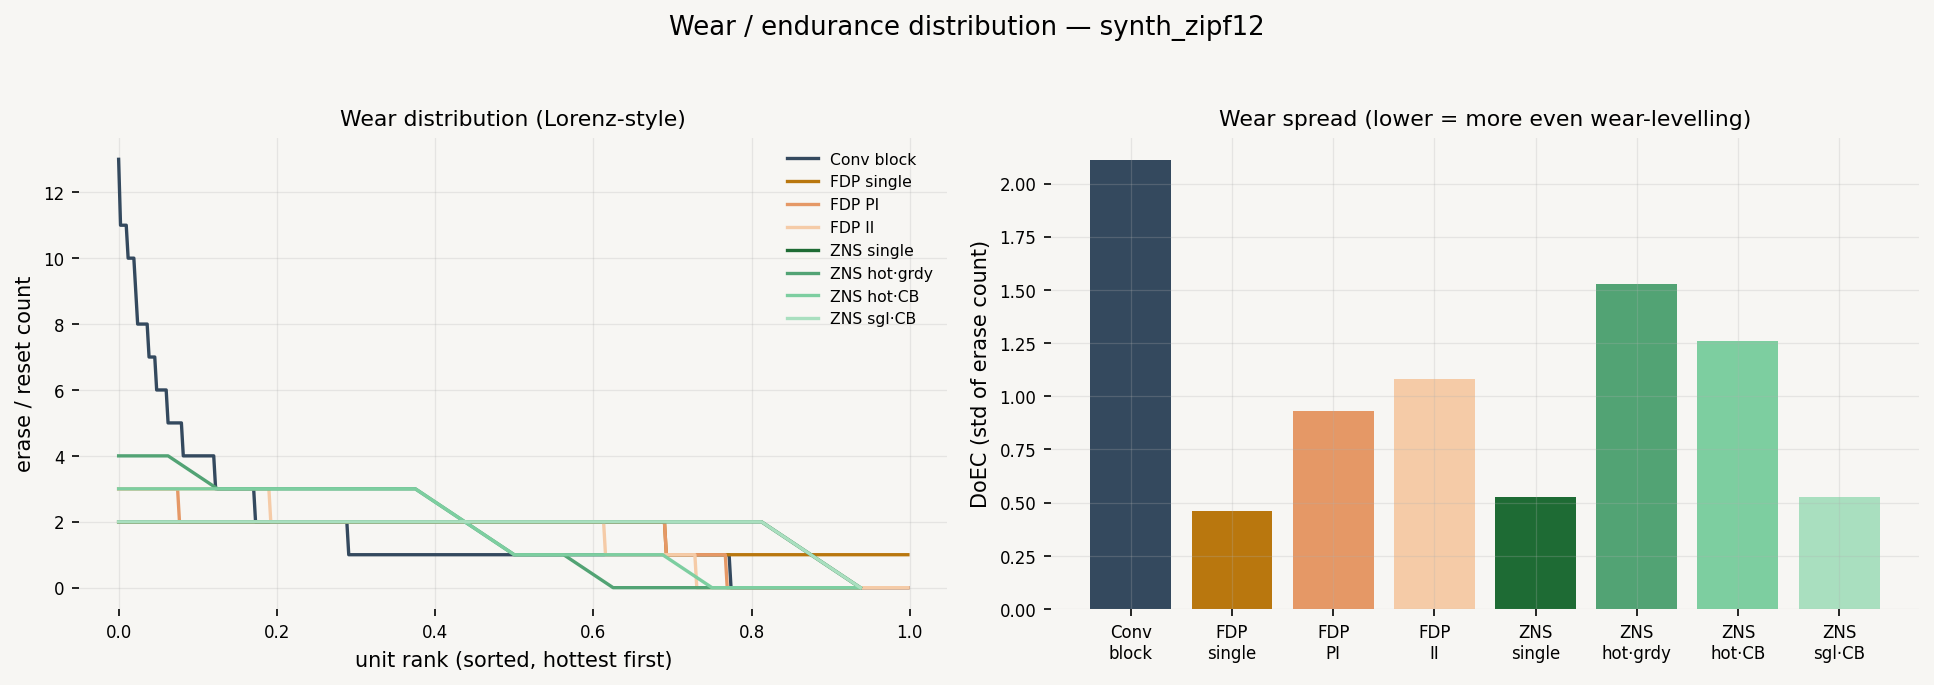
Zipf-1.2 (synthetic)
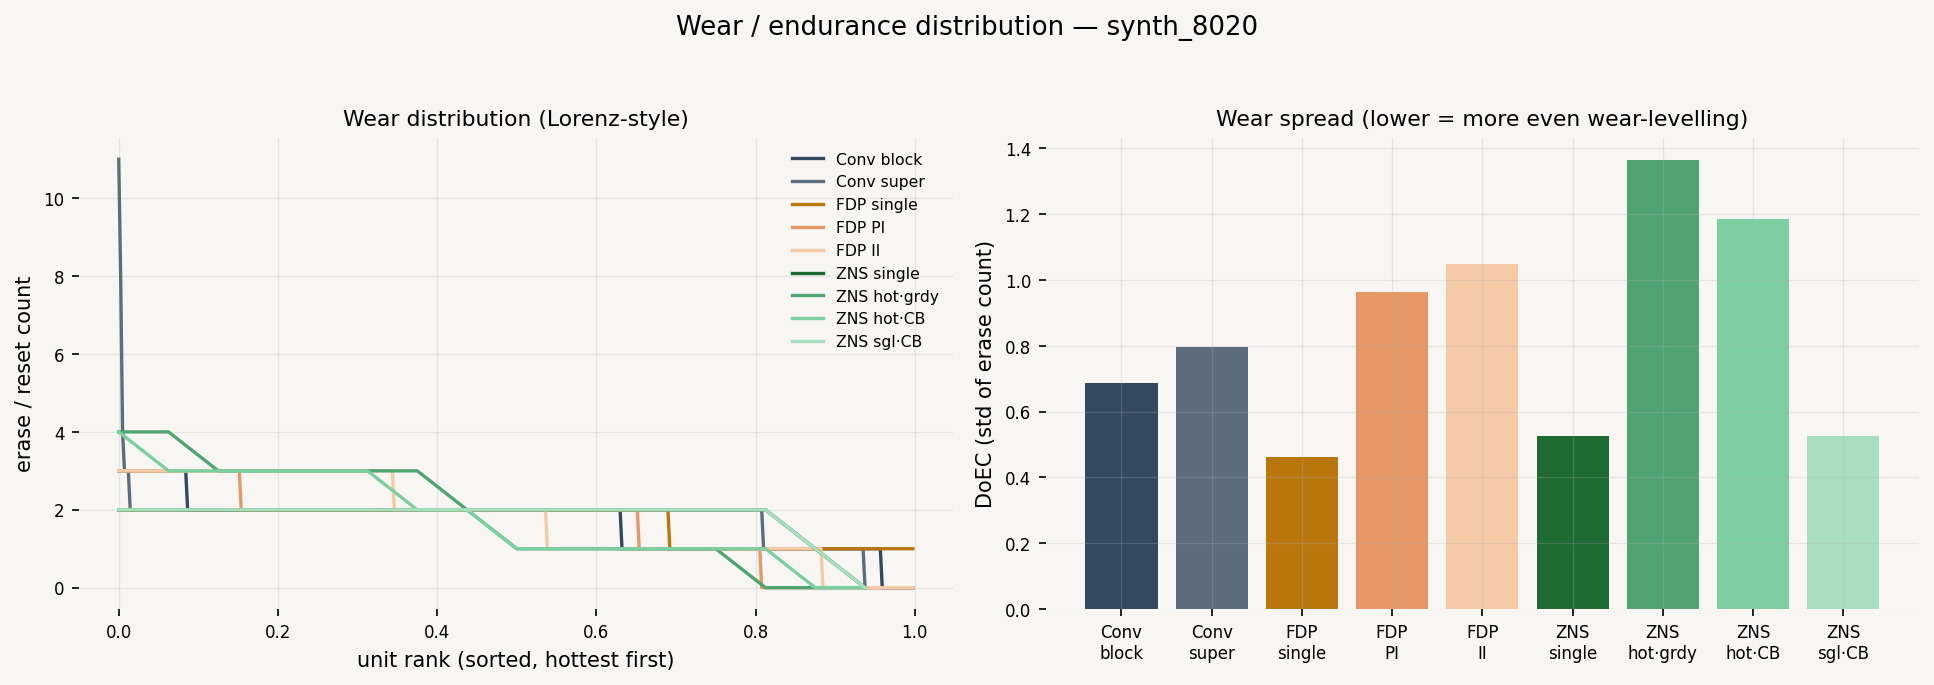
80/20 (synthetic)
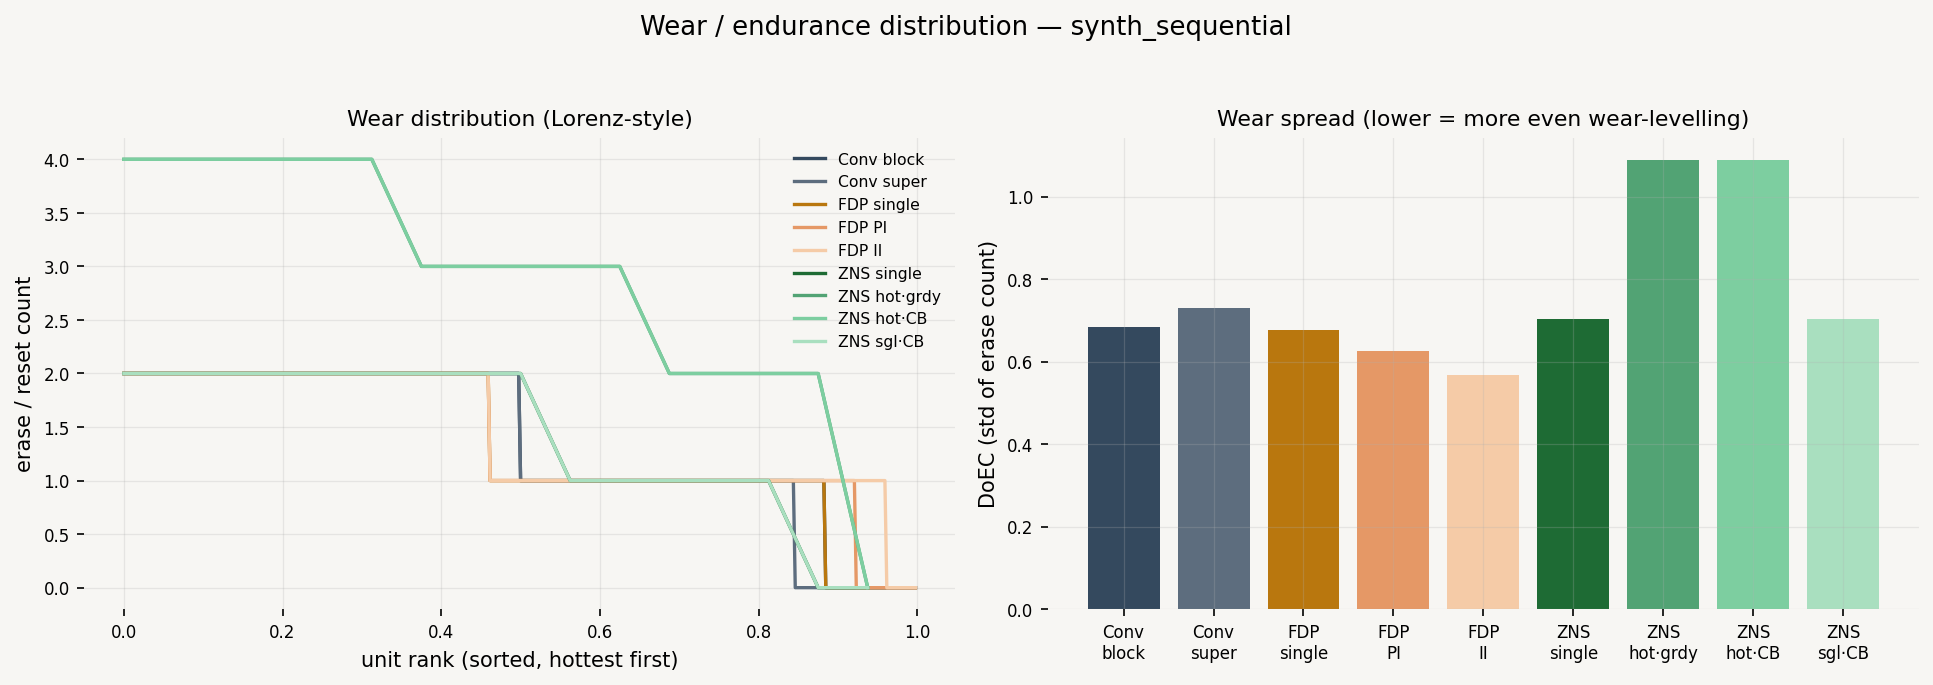
sequential (synthetic)